Post COVID-19
Rethinking FM’s role in IAQ
In the three years battling the COVID-19 pandemic, the world had a painful loss of more than 6.85 million people, with a myriad of others suffering from long COVID conditions. Early in the battle, most people thought that the disease was not transmitted through air. After around two years, airborne transmission of the disease was confirmed, bringing the importance of indoor air quality (IAQ) to the forefront. Since then, the understanding of good air quality has been reshaped and research directions for combating COVID-19 in general built environments have been signposted. In the post COVID-19 era, it is vital to rethink the role of facility management in managing IAQ.
What is good air quality?
Many professional institutions and government agencies have published air quality standards or guidelines to define good air quality which typically is represented by certain recommended concentration levels of some pollutants in the air over certain exposure time periods. Among such standards or guidelines across the world, for example, the LEED Standard and the WELL Building Standard emphasize the level of IAQ contributing to the health and well-being of building occupants. While the World Health Organization (WHO) and the China’s Standard (GB/T 18883-2022) regard that air with quality meeting their recommended limits/thresholds would cause no adverse health effects, the China’s Standard highlights that good air should be odorless. After the COVID-19 outbreak, good air quality may simply mean “clean air” with pollutant concentration levels below the limits stipulated in the IAQ guidelines or standards. Instead, the question of whether the air is safe from causing spread of the disease has become a common concern. This further leads to a question: “Is there a unified standard for formulating IAQ management plans?”
Accordingly, a review was conducted on the air quality standards or guidelines of the world’s two biggest economies (China and the United States) and WHO. Covered in the review include the standards or guidelines published by WHO, the U.S. Green Building Council, the International WELL Building Institute, mainland China and Hong Kong. As shown in Table 1, the limits for some selected air pollutants vary across the publications, with some limits not even specified. For example, respirable and fine suspended particles (PM10 and PM2.5) are subject to a tighter limit of WHO when compared to the limit of GB/T 18883-2022: the limits under the China’s standard are two to three times higher than the counterpart of WHO.
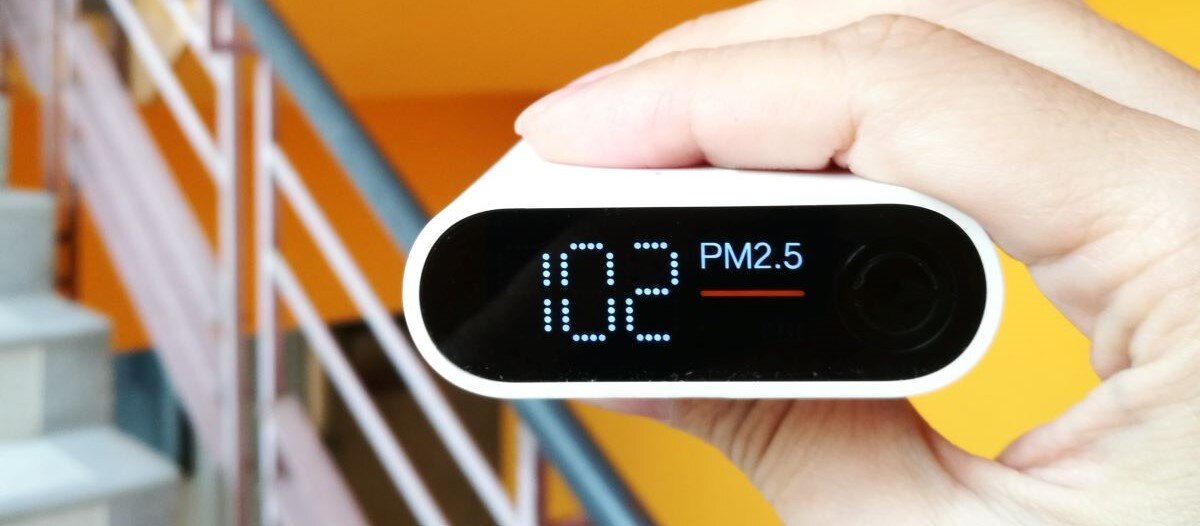
PM2.5 is a concern as it can carry microorganisms and remain in the air for extended periods, increasing the likelihood of disease transmission. Yet, the IAQ guideline published by the Hong Kong Environmental Protection Department (EPD) specifies the limit of PM10 instead of PM2.5. The EPD introduced the limit of airborne bacteria (500 CFU/m3 in eight hours), which is not specified in the LEED Standards, the WELL Building Standard or WHO Guidelines. While research has shown that each 10 μg/m3 increase in PM1.0 increases the risk of pneumonia hospitalization by approximately 8.5 times more than that from PM2.5, PM1.0 (which may contain more toxic pollutants and a larger surface area than PM2.5) is not specified with a limit in the aforementioned standards/guidelines. Of note, there are no recommended concentration limits for airborne viruses. While airborne bacteria including bacteria and fungi can easily replicate on a plate with nutrients and hence can be analyzed by plate counting of their concentration, different types of viruses can infect specific host cells. Thus, it is impractical to conduct air sampling followed by infectivity assay using many types of host cells to cover all types of viruses that may be present in indoor air. Furthermore, quantitative polymerase chain reaction (PCR) commonly deployed to detect and quantify airborne viruses can only target a specific gene expression in the virus DNA/RNA once at a time. Thus, there is no practical method to measure the concentration of general airborne viruses. On the other hand, the infectious dose is onerous to be defined to correlate the healthiness or safety of building occupants.
Facility managers can refer to their local air quality standards and formulate appropriate operation and maintenance plans for their ventilation and air-conditioning systems. However, from a public health perspective, there are many more physical, chemical and microbiological parameters to consider when evaluating IAQ in space. Even if the measured IAQ level at certain time intervals can meet the target level, its ongoing compliance remains critical.
How to improve IAQ?
To improve IAQ, common strategies include increasing outdoor air supply, upgrading central air filtration to MERV-13 or higher, and extending the operating hours of ventilation, and air conditioning systems. However, these measures may require retrofitting work and may significantly compromise the existing energy-saving measures in buildings. Air purifiers are a cost-efficient way to improve IAQ by delivering an increased air change per hour (ACH). Air purifiers can draw near-ground air through a high-efficiency particulate air (HEPA) filter and deliver filtered air from the top outlet, creating a piston-like effect on air cleaning. Clean air delivery rate (CADR) is a useful metric that characterizes an air purifier's capacity and is used to estimate the additional ACH provided by an air purifier (divide the CADR by room size).
It is important to note that a high CADR does not guarantee good air quality in a space. CADR refers to the delivery of contaminant-free air for a specific contaminant. For example, ANSI/AHAM AC-1:2020 requires three challenge aerosols, including cigarette smoke (0.1-1μm), fine test dust (0.5-3μm), and paper mulberry pollen (5-11μm) for testing CADRs of air purifier. An air purifier tested under ANSI/AHAM AC-1:2020 will have three CADR values for the three different aerosol size ranges, which may vary significantly based on the fractional filtration efficiency of the HEPA filter. GB/T 18801-2022 includes CADR testing against different gaseous compounds, such as formaldehyde, ammonia, and TVOC. Without specifying the target pollutants, a single CADR value may not lead to a definite representation if there are multiple indoor air pollutants. An air purifier equipped with a HEPA filter and anion generators can effectively remove PM2.5, radon and even airborne bacteria, but removal of gaseous pollutants such as TVOC and formaldehyde requires an absorption filter and other chemical reactions to decompose these pollutants.
Lifecycle cost is typically an indispensable consideration for facility managers. As a filter of an air purifier becomes loaded with either solid or gaseous pollutants, the CADR of the air purifier will decrease. Pollutants adsorb or captured in the filter may detach, making regular replacement of the filter vital for ongoing IAQ control. FMs can refer to the cumulative clean mass (CCM) for a target pollutant tested for a filter in accordance with GB/T 18801-2022 to evaluate the lifetime of the air filter. As the current air purifier technology cannot effectively remove carbon monoxide, carbon dioxide, nitrogen dioxide or sulfur dioxide, air purifiers cannot entirely replace proper ventilation in a facility.
Table 1. Limits for selected air pollutants*
|
|
China’s Standard GB/T 18883-2022 |
EPD Guideline, Hong Kong a |
LEED O+M: Existing Buildings v4.1 - LEED v4.1b |
WELL Building Standard v2 |
WHO Guidelines for Indoor Air Quality (2010): selected pollutants |
|
Airborne Bacteria |
1500CFU/m3 |
500CFU/m3 (8hr) |
n.a. |
n.a. |
n.a. |
|
Ammonia |
0.2mg/m3 (1hr) |
n.a. |
200µg/m3 |
n.a. |
n.a. |
|
Carbon Monoxide |
10mg/m3 (1hr) |
1.7ppm (8hr) |
9ppm |
6ppm d |
100mg/m3(15min), 35mg/m3(1hr), 10mg/m3(8hr), 4mg/m3(24hr) h |
|
Carbon Dioxide |
0.1% (1hr) |
800ppm (8hr) |
700ppm above outdoor ppm (Industry Benchmark: 1000ppm) c |
900ppm or 500ppm above outdoor ppm e |
n.a. |
|
Nitrogen Dioxide |
0.2mg/m3 (1hr) |
40µg/m3 (8hr) or 100µg/m3 (1hr) 21ppb (8hr) or 53ppb (1hr) |
n.a. |
40 µg/m3 d |
200µg/m3 (1hr) or 10µg/m3 (1-yr) h |
|
Ozone |
0.16mg/m3 (1hr) |
50µg/m3 (8hr) |
147µg/m3 |
100µg/m3 f |
60µg/m3 (Peak Season) or 100µg/m3 (8hr) h |
|
Particulate Matter (PM2.5) |
0.05mg/m3 (24hr) |
n.a. |
15µg/m3 |
12µg/m3 d |
5µg/m3 (1-yr) or 15µg/m3 (24hr) h |
|
Particulate Matter (PM10) |
0.10mg/m3 (24hr) |
20µg/m (8hr) |
n.a. |
30µg/m3 d |
15µg/m3 (1-yr) or 45µg/m3 (24hr) h |
|
Sulfur Dioxide |
0.50mg/m3 (1hr) |
n.a. |
n.a. |
n.a. |
≤40µg/m3 (24hr) h |
|
Total Volatile Organic Compounds |
0.60mg/m3 (8hr) |
200µg/m3 (8hr) |
500µg/m3 c |
n.a. g |
n.a. |
|
Formaldehyde |
0.08mg/m3 (1hr) |
30µg/m3 (8hr) or 70µg/m3 (30min) |
33µg/m3 |
9µg/m3 d |
0.1mg/m3 (30min) |
The COVID-19 pandemic presents an opportunity for FMs to reevaluate the definition of clean and safe air. Despite the non-unified IAQ standards identified from the above review, FMs should review any past outbreaks in buildings or premises they manage and, if feasible, examine their causes and ascertain whether they were due to poor IAQ such as insufficient ventilation or filtration. While the pandemic has increased demand for air purifiers as a short-term solution to reduce transmission risk, a thorough and regular review should be conducted to ensure their effectiveness and performance, including the lifetime of maintaining an acceptable CADR.
FMs should also critically assess the effectiveness of their ventilation, filtration and monitoring systems to prepare for guiding against similar pandemics in the future. For this purpose, an in-house IAQ management plan should be established, based on which the performance of facilities such as ventilation systems, air purifiers, and air quality sensors should be comprehensively assessed. Correspondingly, an appropriate operation and maintenance plan should also be formulated to ensure the ongoing and long-term performance of the facilities. With the increasing availability of smart systems in this Industry 4.0 era, FMs may also consider utilizing advanced sensing or wireless technologies, such as laser sensing for PM1.0, electrochemical sensing for TVOC and the Internet of Things, to upgrade their existing facilities and monitor more closely the IAQ in their buildings, so as to meet or even surpass the recommended minimum levels of the current IAQ standards or guidelines.


References
Law et al. (2021), COVID-19: research directions for non-clinical aerosol-generating facilities in the built environment, Buildings 11(7), 282. doi.org/10.3390/buildings11070282
Wang, X. et al. (2021). Ambient particulate matter (PM1, PM2.5, PM10) and childhood pneumonia: The smaller particle, the greater short-term impact? The Science of the Total Environment, 772, 145509–145509. doi.org/10.1016/j.scitotenv.2021.145509
Yanchao, S. et al. (2021) Study on the effect of air purifier for reducing indoor radon exposure. Applied Radiation and Isotopes, 173, 109706–109706. doi.org/10.1016/j.apradiso.2021.109706
*Refer to the respective publications for exact details.
a Excellent Class of IAQ objectives stipulated in A Guide on Indoor Air Quality Certification Scheme for Offices and Public Places (2019).
b LEED O+M: Existing Buildings v4.1 – Indoor Air Quality Procedure.
c LEED O+M: Existing Buildings v4.1 – Indoor Environmental Quality Performance.
d Chapter A05 Enhanced Air Quality of WELL Building Standard v2. Additional point will be given to PM2.5: 10µg/m3 and PM10: 20µg/m3.
e Chapter A06 Enhanced Ventilation Design. Additional point will be given to 750ppm or 500ppm above outdoor level.
f Chapter A01 Air Quality of WELL Building Standard v2.
g WELL moved to considering individual limits of VOCs instead of TVOC (see resources.wellcertified.com/articles/well-tip-navigating-the-new-voc-requirements-in-well-v2/)
h WHO Global Air Quality Guidelines (2021); same limits of these pollutants apply to both outdoor and indoor settings.
Read more on Facility Operations , Risk Management and Research & Benchmarking
Explore All FMJ Topics